
Location comparison and reports for shift-based businesses: several locations or a whole chain.
All locations side by side, with the plan and labour cost, before the month closes.
Location comparison in Proplanum puts locations, regions or sectors in one view. The numbers come from the schedule and from actual hours, not from questions to managers. These numbers need no till data. Footfall data is only needed for demand-based staffing.
On the call we compare staffing and labour cost using your numbers.
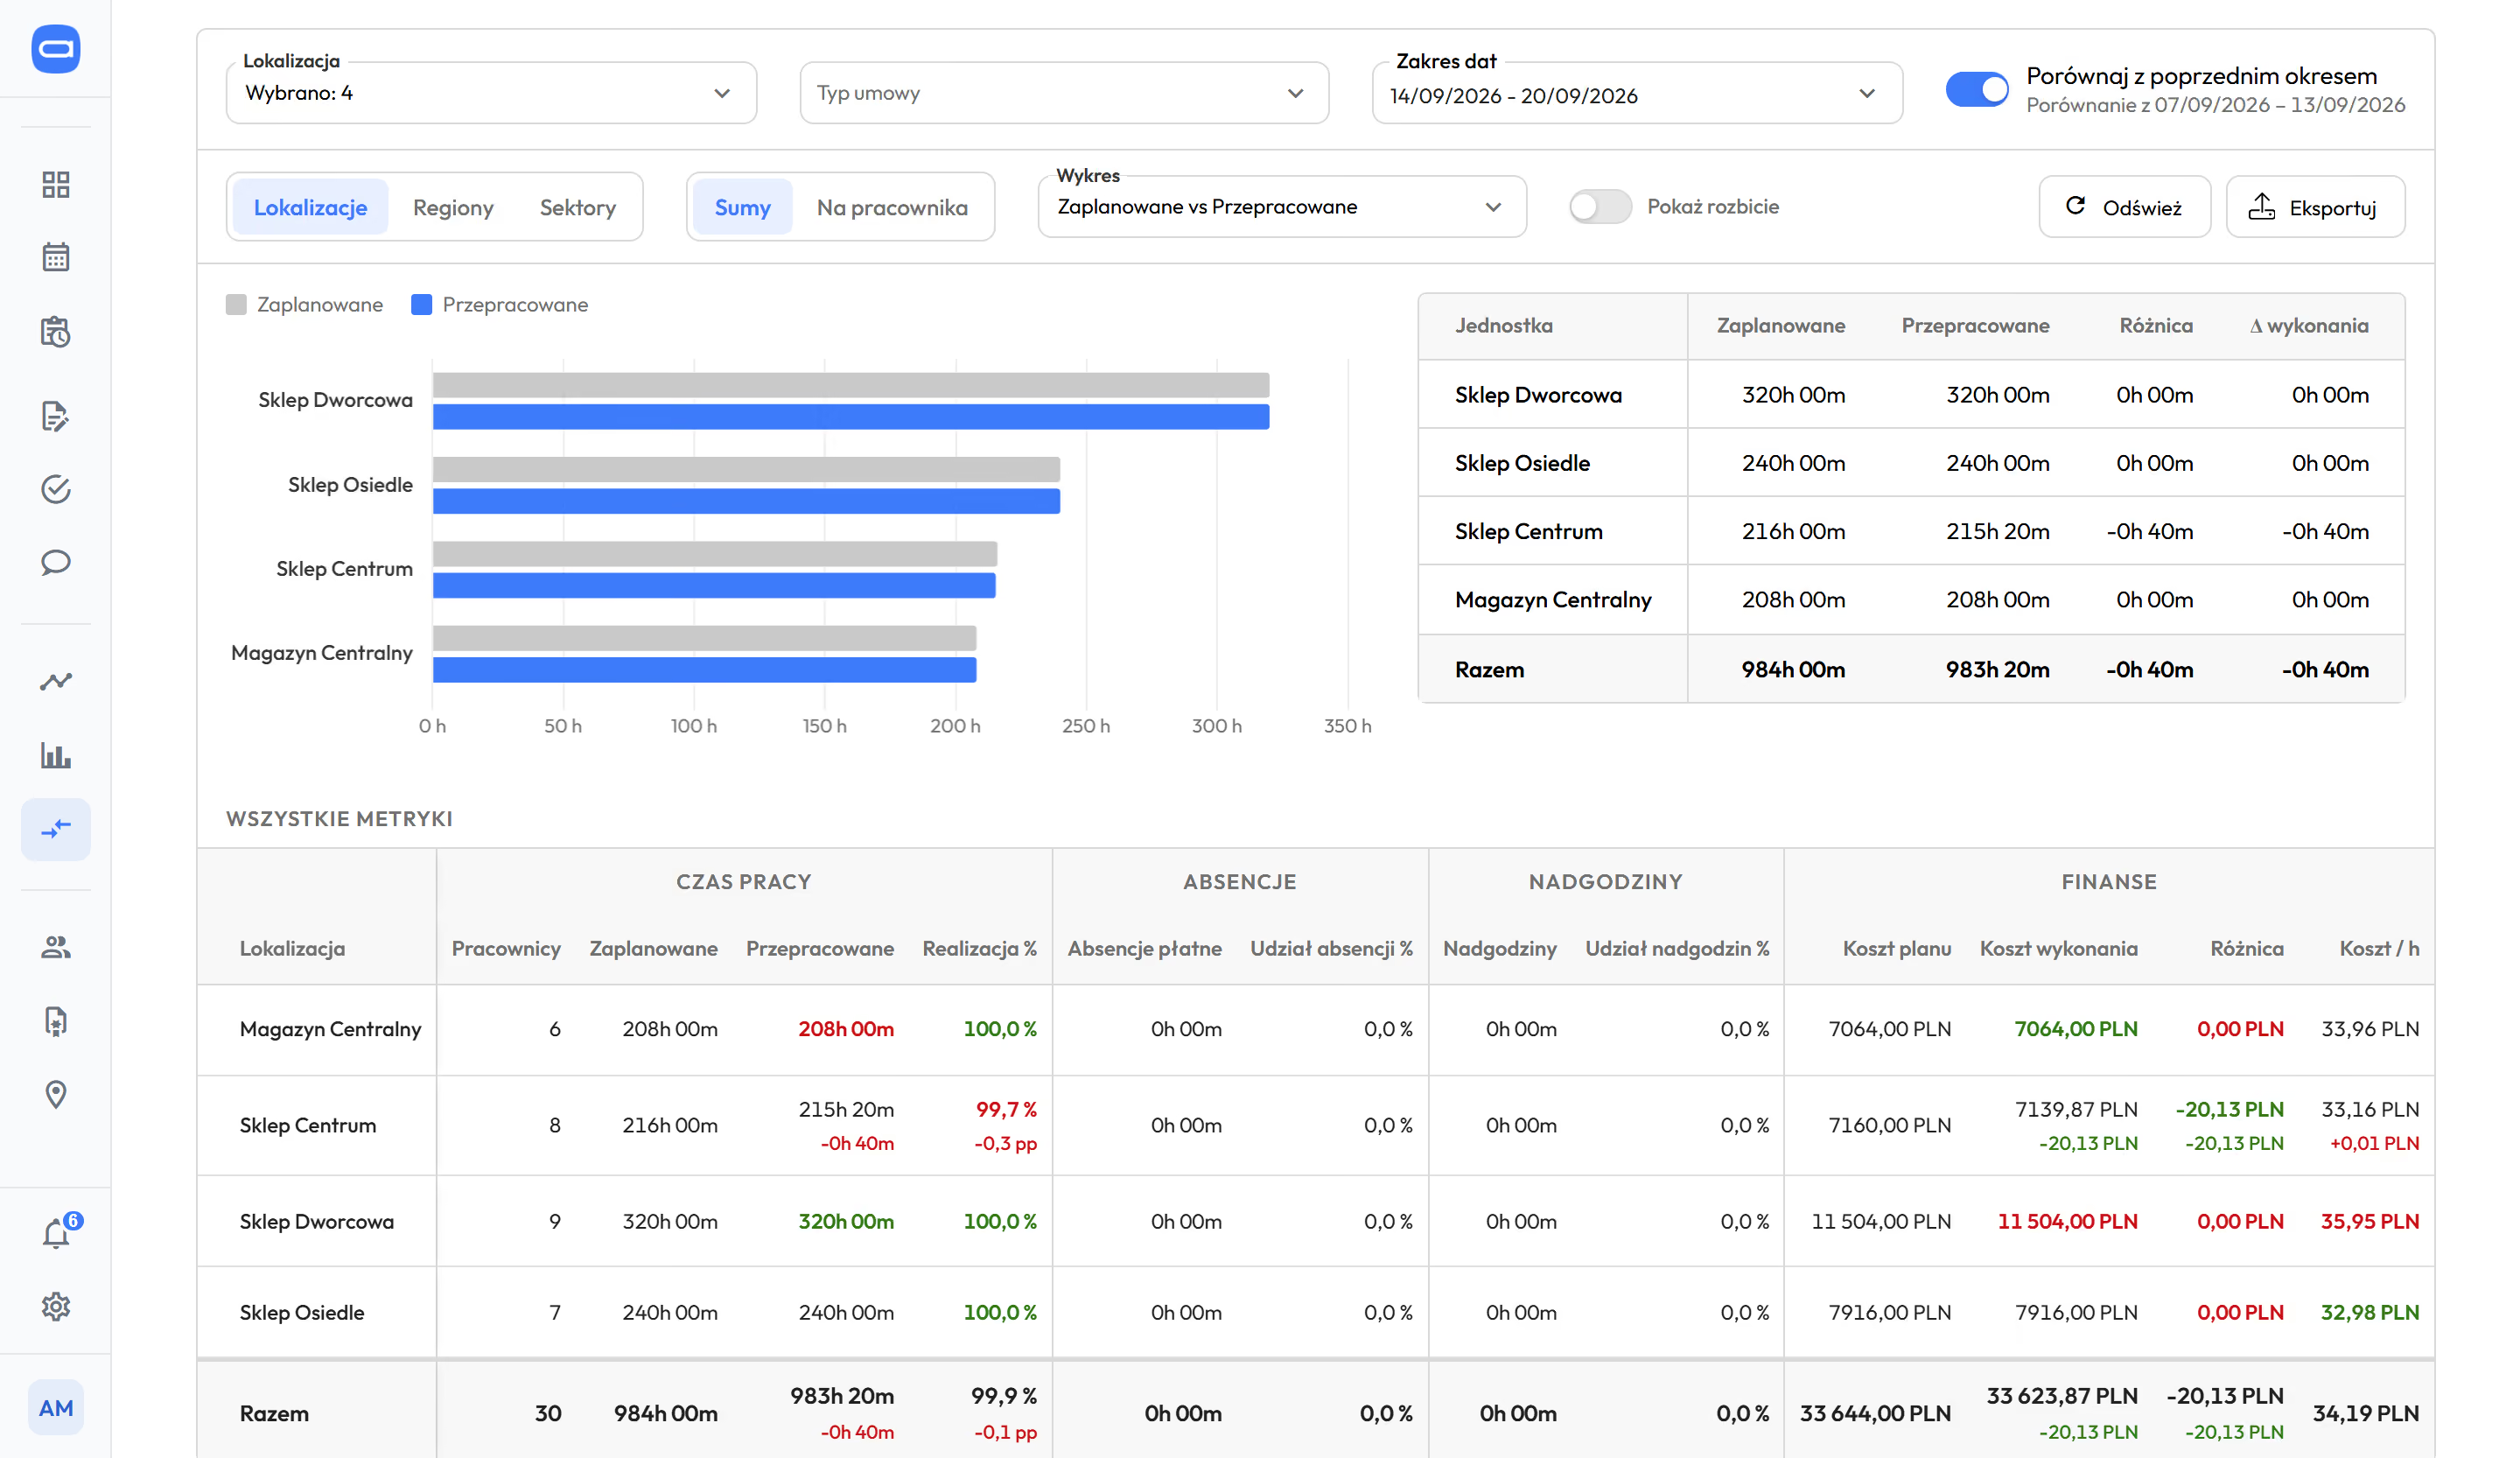
Locations side by side: planned and actual hours, overtime, cost per hour. Demo data. The app is available in English.
Prices in US dollars (USD), excluding VAT.
The HR and payroll system shows these numbers after the month closes. This view shows them during the month. Book a 30-minute call
The same view for one location, a region and the whole chain. fromPremium
You set up the company as sectors, regions and locations. The view follows this structure, so nobody pieces it together from spreadsheets.
- Locations.
Store by store, warehouse by warehouse, one table.
- Regions.
The regional director sees their locations without driving round or phoning.
- Sectors.
Your own split of the company: retail, logistics, restaurants, however you work.
Totals or per employee. A location with twenty people can be compared with one with six.
Working time, absences
- employees
- planned hours
- hours worked
- plan completion
- paid absences
- night, Sunday and public holiday work
Overtime and finance
- overtime
- planned cost
- actual cost
- difference
- cost per hour
- comparison with the previous period
This view goes up the chain as an export, with no retyping into a spreadsheet.
Multi-location chains: how it worksComparison with the previous period
One switch puts the numbers from the previous period alongside.
You see at once where cost and overtime are falling and where they are rising.
You see the gap between plan and actual in the week it appears.
plan next to actual from Bizneslocation and period comparison from Premium
The plan is the schedule for the period. Actual is the hours from the app and the kiosk. The difference is calculated automatically, day by day.
- 1
Plan. The schedule for the period, with the cost for each person.
- 2
Actual. Hours from time tracking appear next to the plan.
- 3
Difference. Plan completion, overtime and cost per hour, updated during the month.
The conversation with the location manager happens before the period ends, not after payroll. You correct the schedule during the reference period (the period over which working time is settled), before overtime builds up.
The same view for the previous month or the previous year shows whether the change lasts.
Labour Code and working time: where overtime comes fromWhat plan next to actual shows this month improves the staffing rules for the next one. The manager makes the adjustment.
Summaries take you from hours worked to the amount to pay. fromBiznes
Your payroll team does not count the month in a spreadsheet. Summaries take hours, absences and overtime from the same place as the schedule.
- Overview
- Hours summary
- Overtime
- Financial summary
- Leave balance
- Data source switch: working time records or the schedule. You can count overtime from the plan alone, before it happens.
- The amount to pay and the settlement status next to each person.
- Filters by location, contract type and date range.
- Your own export codes. You build spreadsheet reports yourself from the same data, without ordering a service.
- Export for HR and payroll systems, with import instructions for each one.
The reports module extends Summaries and location comparison with eight reports and a chart and export builder, in the Enterprise plan.
Hours to payroll without retyping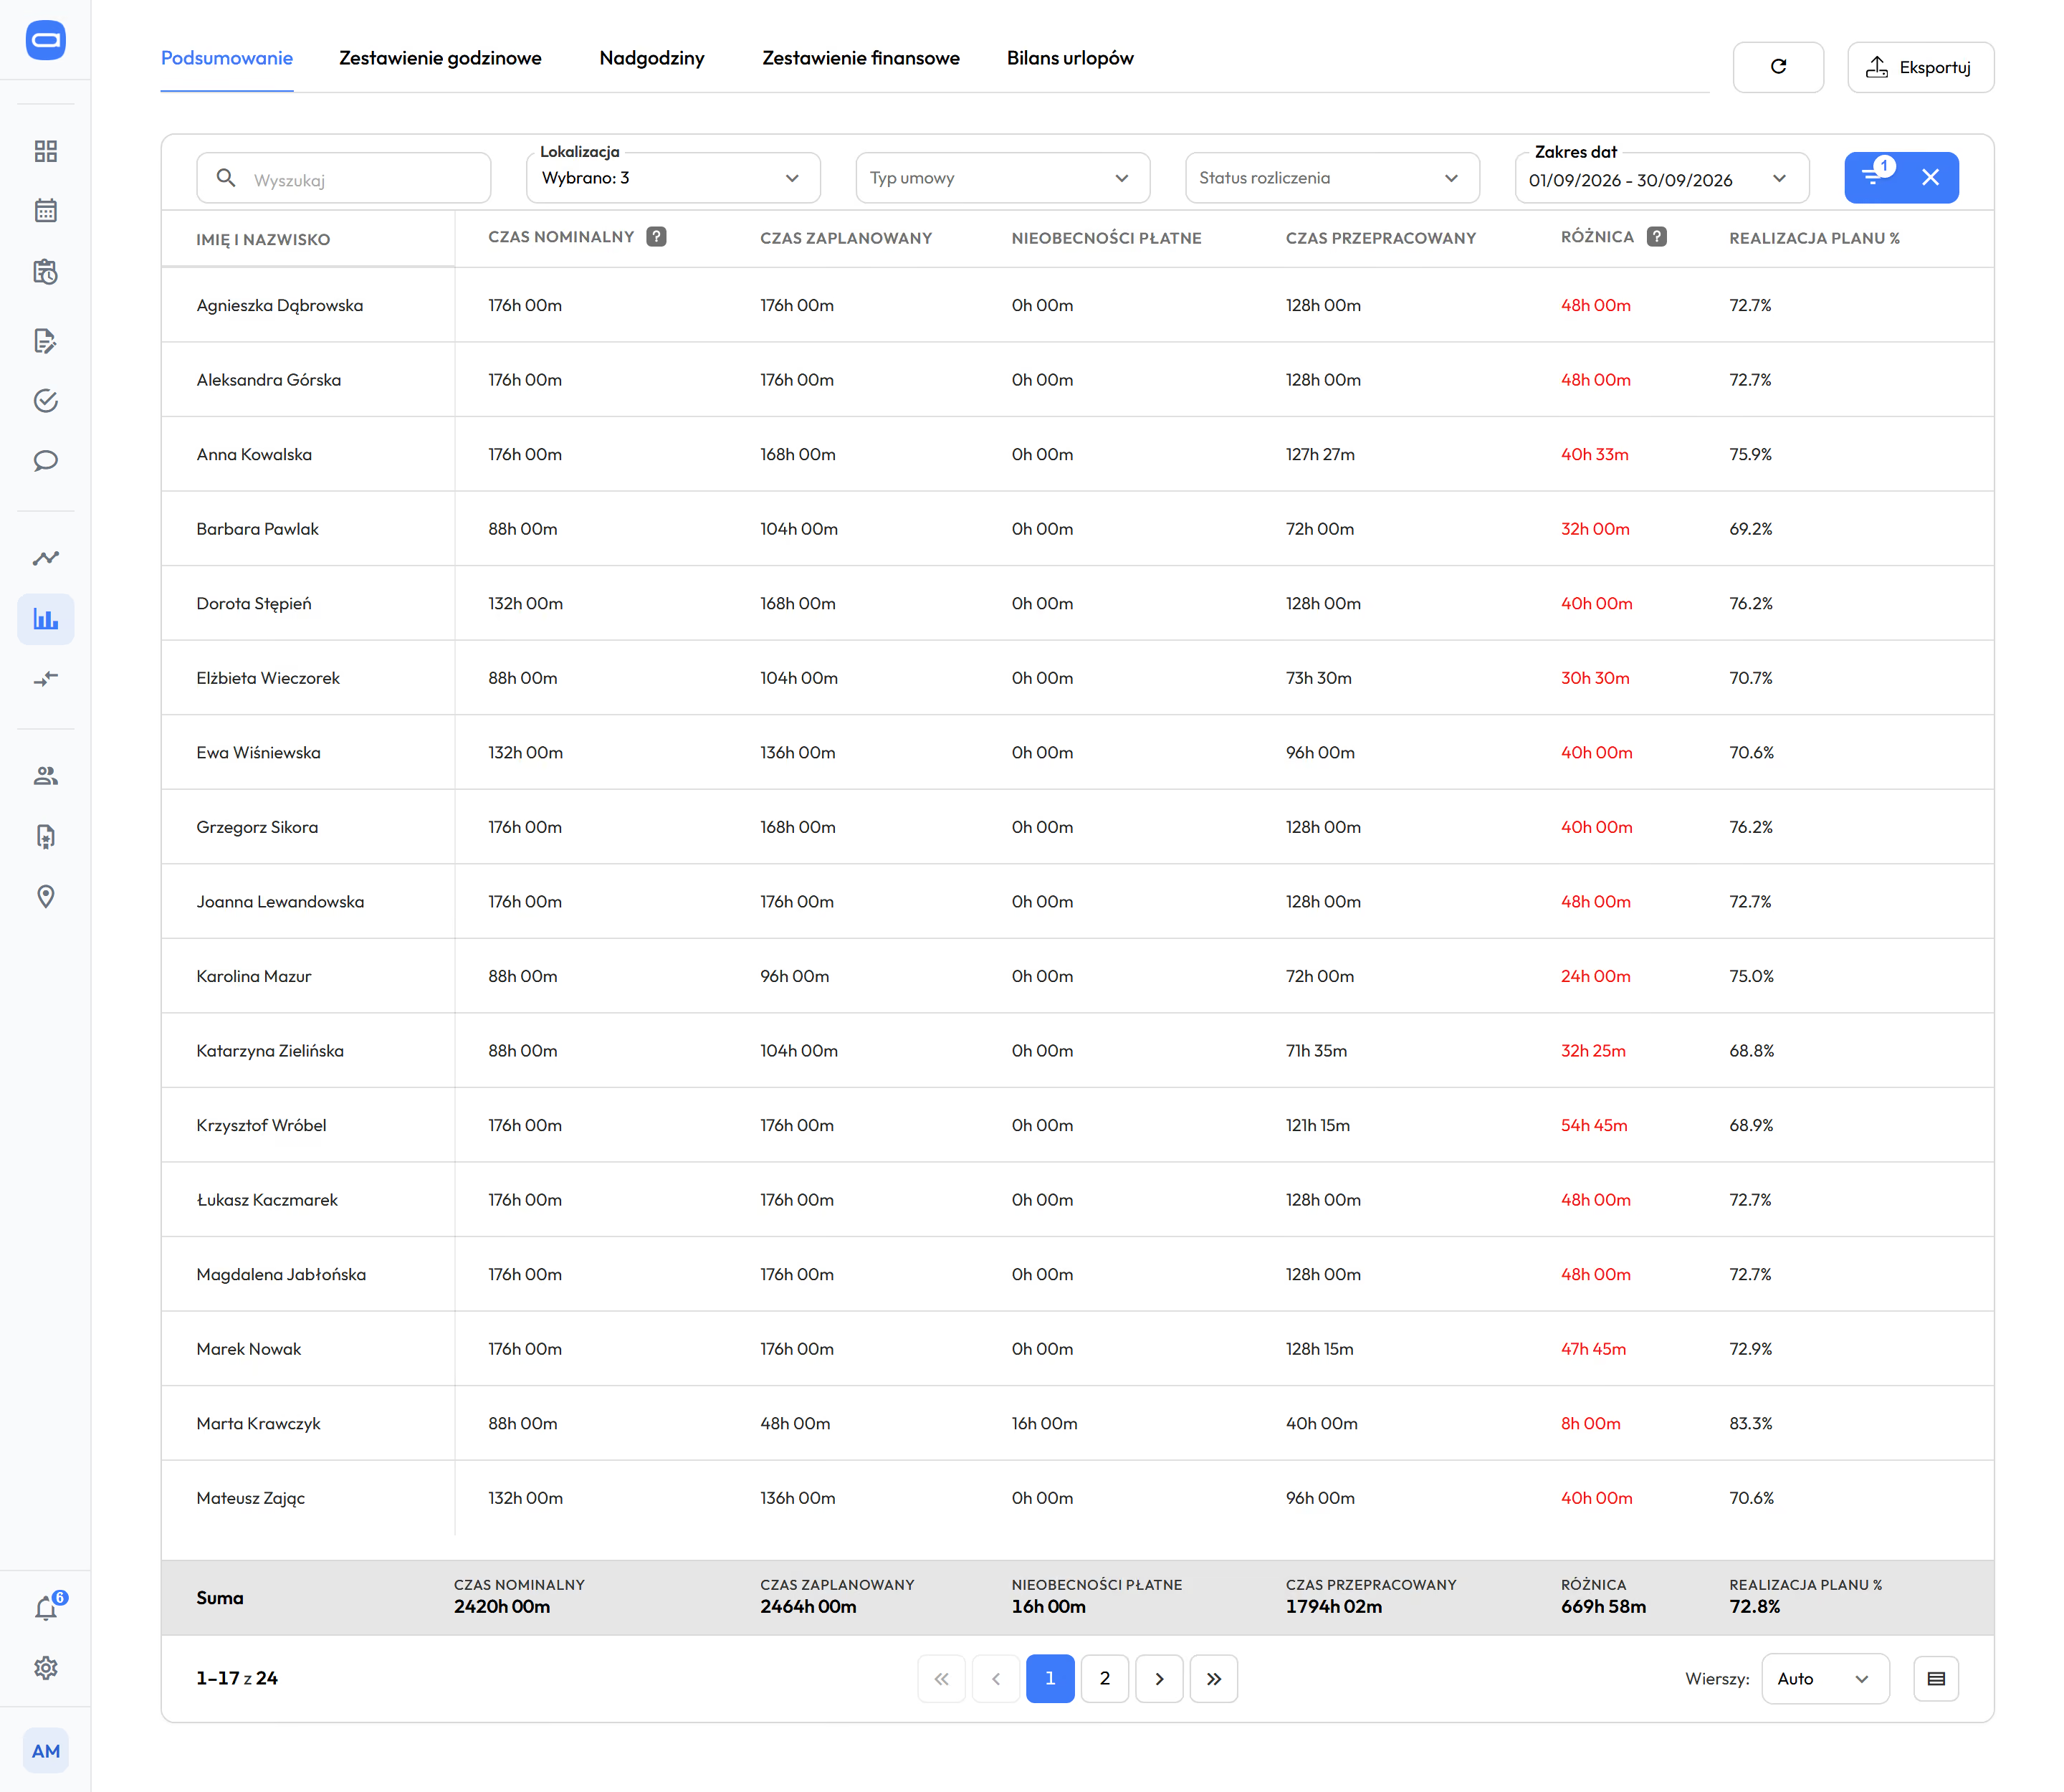
Monthly Summary for three locations: planned time, worked time and plan completion. Demo data. The app is available in English.
The manager dashboard shows what awaits a decision in this location. fromStart
Needs attention
- Pending requests
- Unassigned shifts
- Unapproved time entries
- Contracts ending soon
- The “Needs attention” block: pending requests, unassigned shifts, time entries to approve, expiring contracts and documents.
- Period overview: shift coverage, hours worked next to planned hours, overtime.
- The director sees the location comparison, the manager sees their list for today. The same data, two views.
- A manager sees their own locations. The administrator and the advisor see the whole company.
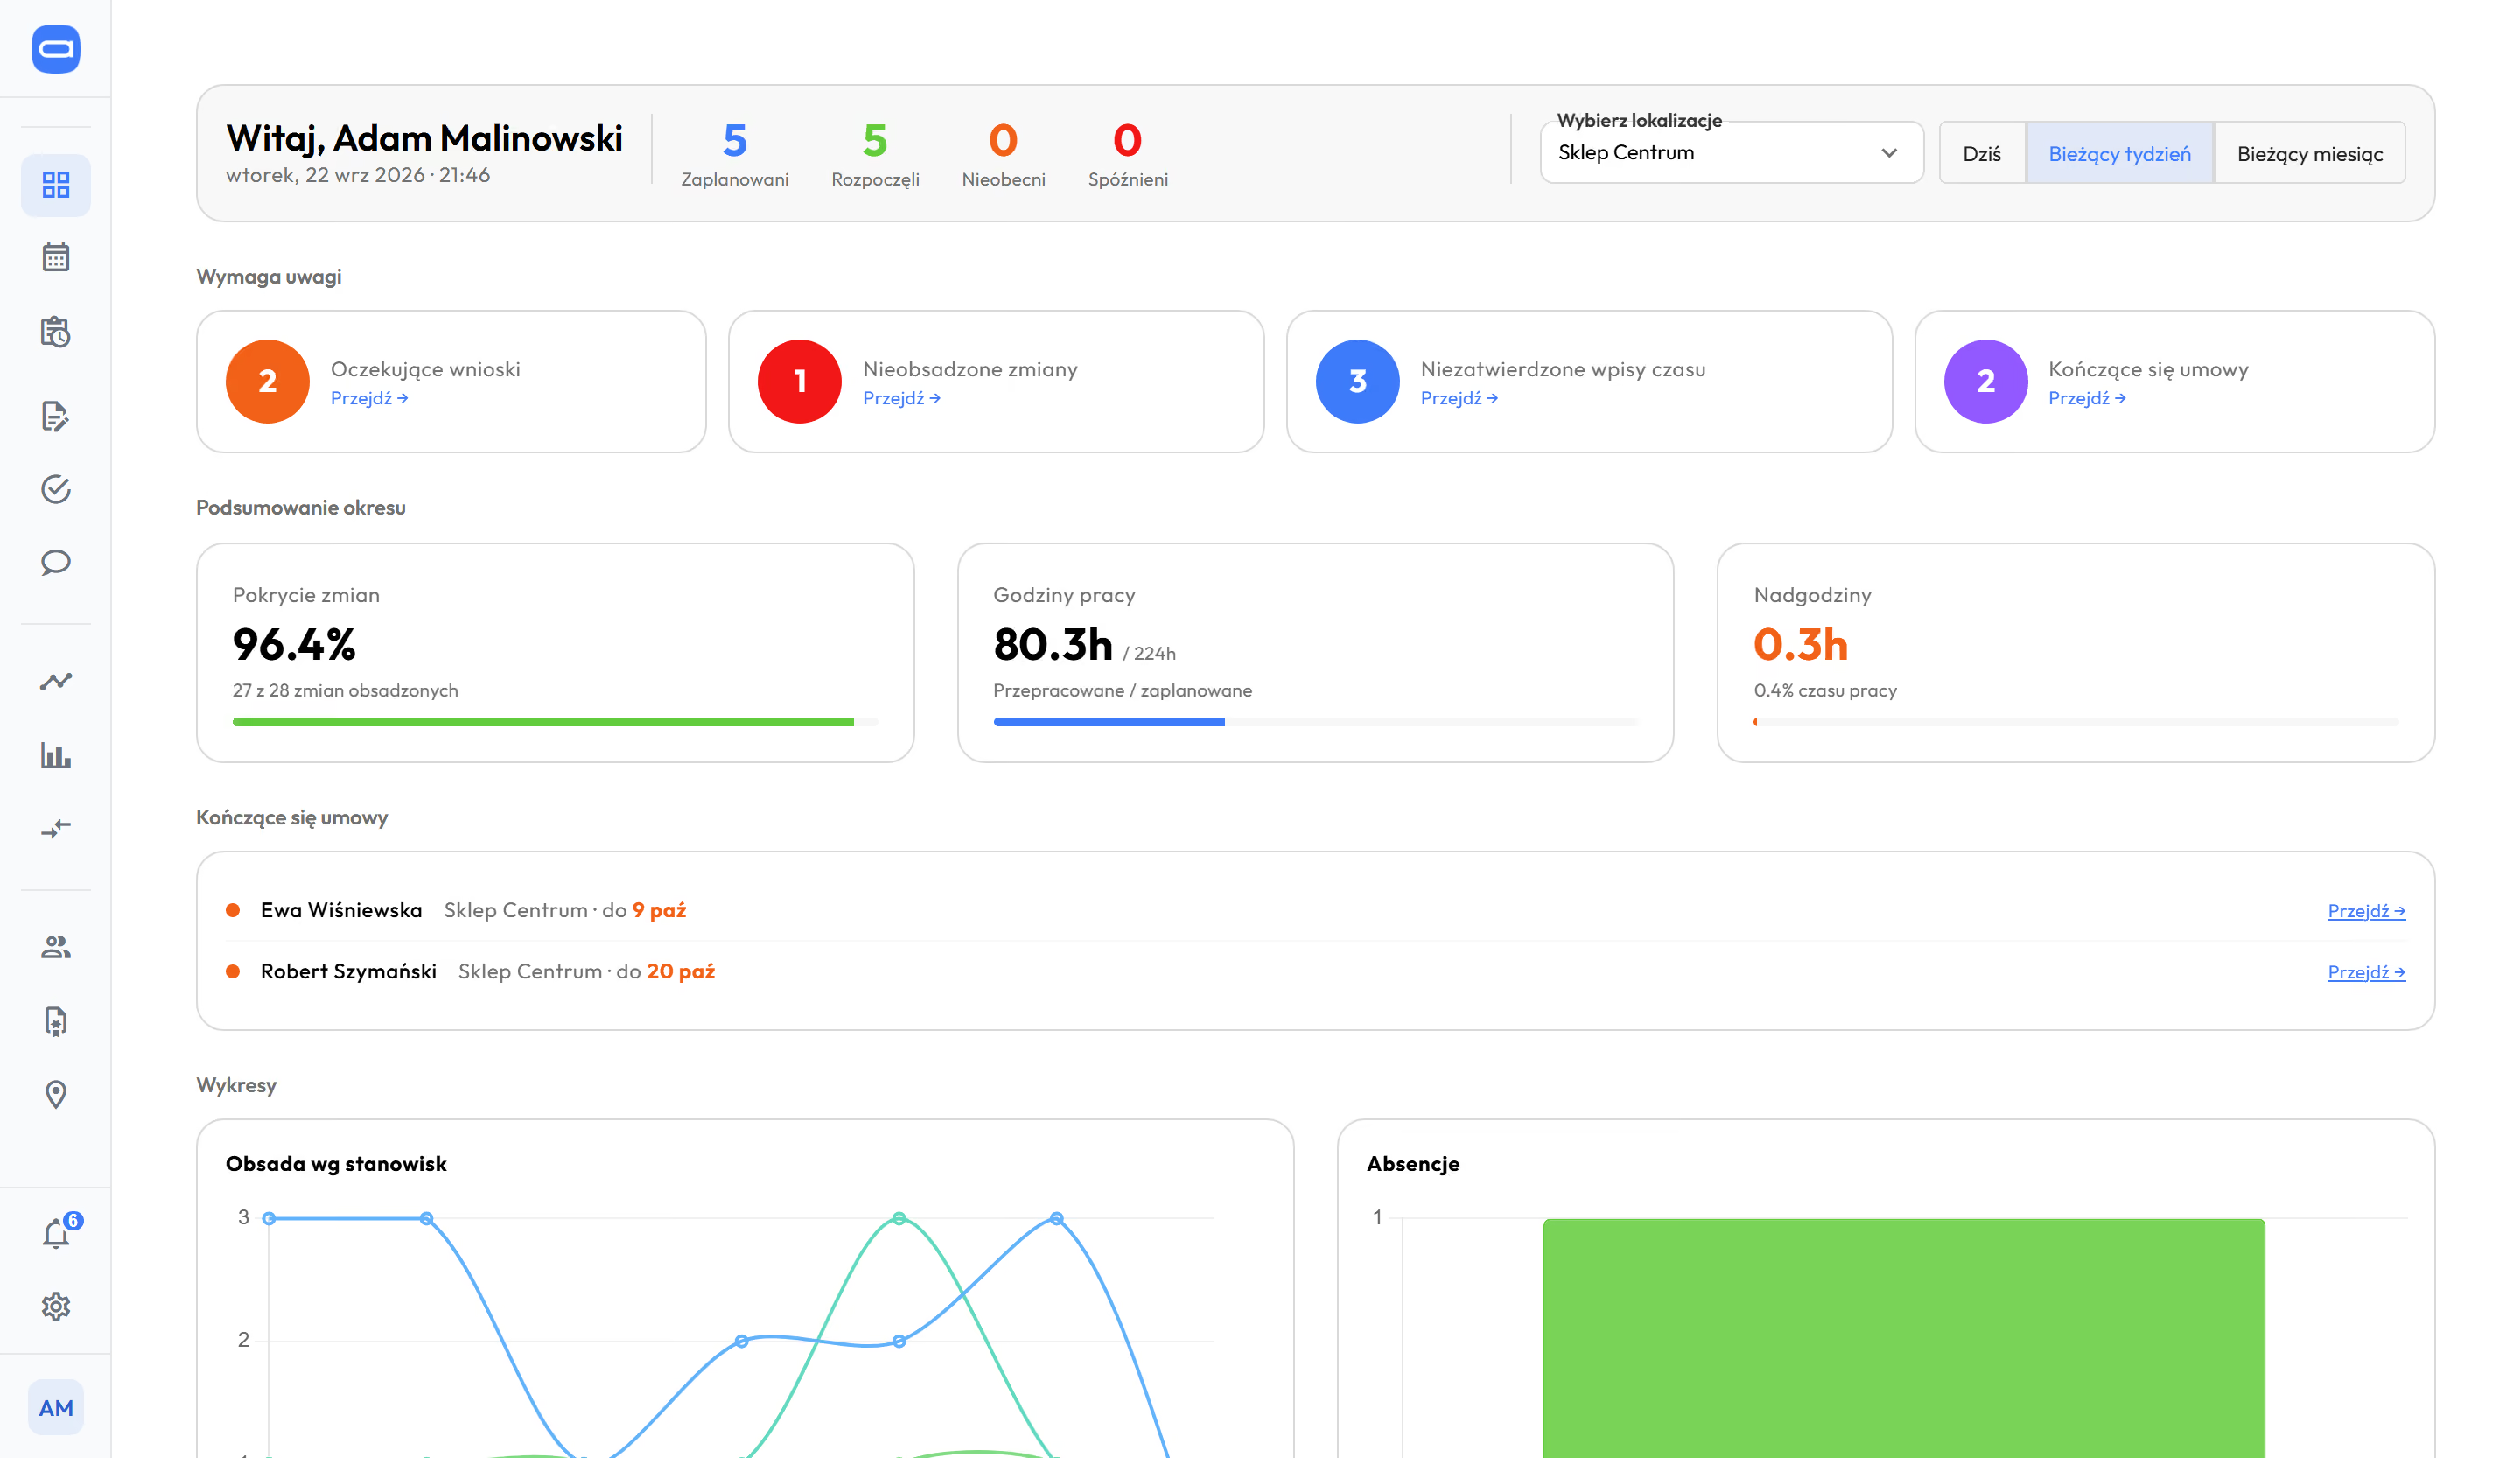
Manager dashboard for one location: what needs attention and a summary of the week. Demo data. The app is available in English.
Implementations counted in locations, not companies.
from a few to several hundred locations
- about 9%lower labour cost with the same service level, within a quarter. Retail chain.
where this number comes from
Labour cost in the quarter after implementation against the quarter before, with the same service level. - over one fifth higher sales per hour worked in the busiest store and one tenth higher across the chain, in three months. Supermarket chain, till data.
where this number comes from
Sales divided by hours worked, three months after demand-based staffing started. - over 8,000employees at our largest customer. As of September 2026.
where this number comes from
Number of employees in one customer's company.

Questions people ask when they first see these numbers.
Where do these numbers come from if we have no till data?
From the schedule and from actual hours. Plan, actual, overtime and cost per hour need no footfall data at all. Till data is only needed for demand-based staffing.
How does Proplanum know how many hours were really worked?
From time tracking: on the phone, at the kiosk on a tablet or in the browser. Each clock-in appears next to the planned shift, and the manager approves the entries. Time tracking is in plans from Biznes.
Will we see this earlier than in payroll?
Yes. The view is calculated during the month, day by day. Comparison with the previous period shows whether the difference holds.
Who in the company sees which locations?
A manager sees their own, and the administrator and the advisor (HR and accounting) see the whole company. You set up the structure of sectors, regions and locations yourself.
Can we export this to our spreadsheet and to payroll?
Yes. The comparison view has an export, and hours and absences go to payroll as an export with import instructions. You build your own export codes yourself.
How many locations can it handle?
Implementations reach several hundred locations. At a larger scale we set up a call about your structure before we promise anything.
We use another system. What does data transfer cost, and will it stop our work?
With a self-service start, data transfer is part of the implementation included in your plan. Import from several systems is quoted with implementation. We have tools to make it quick without disrupting your work. You choose the date.
The call takes 30 minutes and ends with staffing compared against labour cost.
- Scale and structure.How many locations, which regions, who builds the schedule today.
- Staffing and labour cost on your data.Plan next to actual, using your chain as the example.
- What implementation means on your side.Who does what, and in which week.
With a self-service start, remote configuration with your account manager and online training are included in the plan price. We quote implementation with on-site days with your account manager, on-site training or an integration built for your systems separately, with the price agreed before the start. With a dozen or more locations, it is usually the second option.
Hours and absences go to nine HR and payroll systems used in Poland, with import instructions, plus two-way ADP and electronic sick notes (e-ZLA) from ZUS, the Polish social insurance institution. Moving from another system? With a self-service start, data transfer is part of the implementation included in your plan. Import from several systems is quoted with implementation.
nine systems
- Comarch Optima
- R2Płatnik
- enova365
- Symfonia
- Gratyfikant GT
- Gratyfikant nexo
- Wapro Gang
- SAP
- DATEV LODAS
Book a 30-minute callStart a 21-day trial
in plans from PremiumPricing
A dozen locations or more? Book a 30-minute call.
Thank you, we have your details.
We will call you back on the number you gave. Monday to Friday, 8:00 to 16:00, Central European Time (CET), we reply the same day. After 16:00 and at weekends, we reply by 12:00 on the next working day.